As the brain matures, synapsis occurs, strengthening frequently used neural pathways and discarding those deemed unnecessary. Areas of the brain become less, not more, dense as they mature after age five thanks to the “pruning” nature of synapsis.
Uncategorized
Modern Malnutrition
Malnutrition not only affects the developing brain but compromises the child’s immune system, increasing the frequency of illness while also elongating the effects. Causes of malnutrition vary greatly
Acute malnutrition is characterized by the loss of body fat and wasting of skeletal muscle. Acute malnutrition is typically caused by a sudden period of food shortage while Chronic Malnutrition refers to a prolonged period of insufficient access to both macro- and micro- nutrients. Chronic malnutrition may have devastating lifelong impacts on the body including mental functions, physical mobility and the acquisition of social skills.
Malnutrition during early life influences a child’s metabolism, inhibiting the natural progression of physiological growth and development patterns. Children who are malnourished are at increased risk for cardiovascular and kidney diseases, developing diabetes later in life. Malnutrition is also now considered a risk factor obesity and metabolic syndrome, characterized by the inability to properly process glucose.
Furmaga-Jablonska, W. et. al. (2014). Malnutrition in the 21st century. Nutrition, 30, 242-243. Retrieved from http://dx.doi.org/10/1016/j.nut.2014.05.001
Prenatal Brain Development
This short video illustrates the prenatal development of the brain, touching on environmental factors that may inhibit healthy development.
Malnourished Relationships
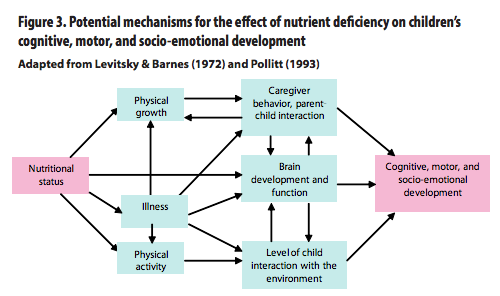
Alive & Thrive published a report in January of 2012 suggesting that malnutrition affects brain development not just directly, but also indirectly as the conditions work to shape the child’s experiences. While nutrient deficiencies physically affect the development of the brain, the child’s daily experience may be altered by subsequent behavioral manifestations. Alive & Thrive asserts that undernourished children may exhibit characteristics, such as frequent illness, irritability and withdrawing that could lead caregivers to react more negatively toward them. Essentially, behaviors caused by malnutrition may be undermining the establishment of securely attached relationships that have become indicative of strong socio-emotional skills later in life.
Alive & Thrive estimates that there are 200 million children globally failing to reach their developmental potential partially due to undernutrition. While many studies of malnutrition focus on the extreme end of the spectrum, it is important to remember that proper nutrition is a balancing act every individual must learn how to manage.
The chart below illustrates how “interventions aimed at either the child or the caregiver may have cumulative and cascading effects over time” (p. 3). The critical nature of the dyadic relationship between child and caregiver makes the potential interruption of attachment devastating.
Reference
Prado, E. & Dewey, K. (2012). Insight: Nutrition and brain development in early life (A&T Technical Brief Issue 4). Retrieved from http://www.aliveandthrive.org/sites/default/files/file-attachments/Technical%20Brief%204-%20Nutrition%20and%20brain%20development%20in%20early%20life.pdf.
The [SAD] Standard American Diet
Mark Hyman, M.D. discusses how the standard American diet has grown too energy dense but nutrient poor, rich in empty calories. Generally, Hyman has found American’s are typically deficient in Magnesium, Vitamin C, D, E and A along with omega-3 fatty acids.
The American diet has shifted dramatically to include more processed foods stuffed with high fructose corn syrup and other refined ingredients while meats are laced with nitrates to preserve “freshness.” Data from the USDA archives suggest that soils nutrients are becoming depleted from industrial farming. Comparisons of 43 fruits and veggies from 1950 and 1999 show calcium down 16%, iron 15% and vitamin C 20%. Larger, less nutritious portions have become less expensive than the food our grandparents once grocery shopped for.
Hyman, M. M.D. (2012 March 8). How malnutrition causes obesity [Blog Post]. Retrieved from http://www.huffingtonpost.com/dr-mark-hyman/malnutrition-obesity_b_1324760.html.
Intriguing Correlations between Scores/Behavior and Parental Income
Katherine Magnuson examines the “causal role of low family income in early childhood for subsequent outcomes during the school year and later in life, including adulthood”
The top row of graphs depicts student standardized test scores by parental income. The second row of graphs illustrates student behaviors (as reported by teachers). Quintile 5 have parents with the highest incomes (the top 20% of the income distribution).
Reference
Magnuson, K. (2013). Reducing the effects of poverty through early childhood interventions. Fast Focus. Retrieved from http://www.irp.wisc.edu/publications/fastfocus/pdfs/FF17-2013.pdf.
Nutrition at School
 Professionals in areas of high poverty often complain of their students lack of motivation, tardiness, absences, difficulty paying attention, and inability to process information as it is being presented. Educators are sometimes quick to “say that parents or guardians do not read to their child, do not encourage their children to read and do not provide enriching mental experiences or teach them proper social and emotional behavior” (Parker & Parker).
Parker and Parker draw our attention to how the educator’s attitude may negatively affect motivation, behavior, self-esteem, and overall academic performance of impoverished students. The authors believe teachers and other professionals working with children must be further educated on the detrimental effects on development brought on by prolonged poverty. Three main areas of the brain are impacted, the prefrontal cortex, hippocampus and amygdala; negative impacts can be seen in social and emotional behavior, memory, attention, goal-setting and decision-making.
A survey of more than 1,000 teachers and principals around the country was conducted by No Kid Hungry of Washington, D.C. in the summer of 2013. Findings show that 73% of teachers typically instruct hungry kids; teachers who see hunger spend an average of $37 a month on food for their students over the course of the school year. Utilization of free or reduced-price breakfast programs brings improvements, but many students do not participate due to late buses, conflicting priorities, and the stigma attached.
Reference
Klein, R. (2013, August 27). You’ll be shocked by how many kids are too hungry to learn in class. The Huffington Post. Retrieved from http://www.huffingtonpost.com/2013/08/27/no-kid-hungry_n_3825071.html.
No Kid Hungry: Share Our Strength. (2013). Hunger in our schools: Teachers report 2013. Retrieved from http://www.nokidhungry.org/pdfs/NKH_TeachersReport_2013.pdf.
Parker, W. S. & Parker, B. A. (2012, May). How poverty and stress affect brain development of children and impact learning and behavior in school. Brain World. Retrieved from http://brainworldmagazine.com/down-and-out-in-childrens-schools/.
“Dealing with a Cycle”
A local article from 2009 suggests that one in four children in Humboldt County lives in poverty. While 18.5% of California residents under the age of 18 are living in poverty, that figure jumps to 24.4% in Humboldt. Kathy Young, director of the Social Services branch of the Humboldt County Department of Health and Human Services, discusses the cascading effects of growing up in poverty that often spill over into the next generation.
Michelle Hensen, an executive assistant at the Humboldt County Office of Education, shares that 52% of the counties children have applied for the reduced lunch program. These applications, according to Hensen, are often the only indication of student income; while 52% have applied for benefits, Hensen believes there are more students eligible.
Professor of Sociology, Jennifer Eichstedt, asserts that poverty affects the kind of care and resources a parent is able to provide for their child. However, the largest factor, in Eichstedt opinion, is being born into the same areas of high unemployment and few job opportunities.
Reference
Greenson, T. (2009 December 6). “We’re dealing with a cycle”: High poverty rate in the county has “cascading effect”. Times Standard. Retrieved from http://www.times-standard.com/ci_13939372.
Taking the SNAP Challenge
In September 2013, Feed America CEO Bob Aiken and other hunger activism leaders took the SNAP challenge, surviving on $31.50, or about 1.40 per meal, for one week.
Aiken reflects on his fortune when he is able to make the 40-minute drive home to pick up his forgotten lunch while going hungry may be the reality of millions SNAP recipients. Aiken also
While Aiken concedes the challenge can’t replicate the myriad of challenges SNAP recipients encounter on a daily basis, he does hope to bring awareness to the limits of federal benefits. Aiken reminds us the challenge isn’t just sticking to the budget, but creating healthy meals.
Alli Sosna, founder of MicroGreens, has completed the SNAP challenge a few times, and suggests these items to help build a healthy diet.
- Brown Rice
- Soy Sauce
- Carrots
- Whole Chicken
- Frozen Veggie Medley
- Garlic Salt
- Eggs
- Onions
- Lentils
- Apples
MicroGreens is a non-profit in Washington, D.C. that aims to educate families and children how to prepare healthy, tasty meals for four on a budget of just $3.50
Sosna states that SNAP recipients cannot purchase too much fruit, but suggests sticking to a plant-based, whole grain diet with lots of drinking water. Sosna asserts she has lost 3 pounds each time she’s done the SNAP challenge.
References
Aiken, Bob. (2013 September 19). Snap challenge begins to take its toll [Blog Post]. Retrieved from http://www.huffingtonpost.com/bob-aiken/snap-challenge-begins-to-_b_3950028.html.
Michael, Dan. (2013 September 12). Can $1.50 provide you with a healthy meal? Taking the #SNAPChallenge by CEO Bob Aiken [Blog Post]. Retrieved from http://blog.feedingamerica.org/2013/09/can-1-50-provide-you-with-a-healthy-meal-taking-the-snapchallenge-by-ceo-bob-aiken/.
Sosna, Alli (2012 December 5). My Top 10 Ingredients for a Healthy SNAP Diet [Blog Post]. Retrieved from http://www.huffingtonpost.com/alli-sosna/food-stamp-challenge_b_2247709.html.
Food Insecurity Across California
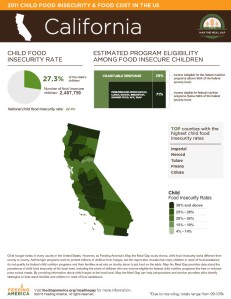
This interactive map from Feeding America illustrates the dispersion of food insecurity across the United States. Food insecurity refers to the USDA’s measure of the lack of access to an adequate amount of nutritious food. A household may not be food insecure at all times, but may sometimes make “trade-offs” between other basic needs and purchasing nutritious foods.
50,120,000 (16.4%) Americans were food insecure as of 2011. Of 16,658,000 (22.4%) food insecure children 19% are likely ineligible for federal nutrition programs.
(Click on photo to go to Feeding America’s interactive Food Insecurity Map)


